
Perhaps the hills aren't alive with the Sound of Music, but they are buzzing with sondes. Sondes are devices that enable us to test the temperature, oxygen levels, and 'cloudiness' (turbidity) of water, giving us vital information on its quality.
I work for the National Water Quality Instrumentation Service (NWQIS), based in Reading. Our team calibrate and maintain the handheld meters and sondes used by the Environment Agency sampling and environmental monitoring teams. We also run the Environmental Sensor Network (ESNET) which uses the sondes to gather data and help monitor the water quality of our lakes and rivers of which there are currently 200 sites.
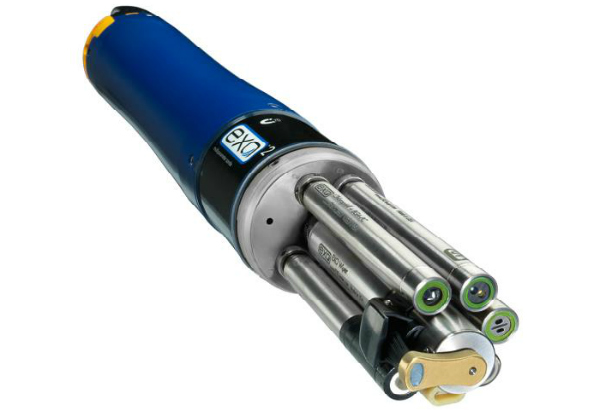
In my role within NWQIS as a Field Scientist I deploy sondes at various locations. Sondes are packed with an array of sensors and being not much bigger than a couple of Pringle Tubes stacked on top of each other, can be easily deployed in a watercourse. They are used to collect information on water quality at particular sites for our Environment Officers and partners such as Natural England, national parks, river trusts, water companies, and universities.
I get to work in some of the most scenic areas of northern England, from floating around in a boat on Coniston maintaining a buoy and looking at long term trends in the lake, to walking to sites in the remote Northumberland hills which are collecting data on the impact of erosion in our upland streams.
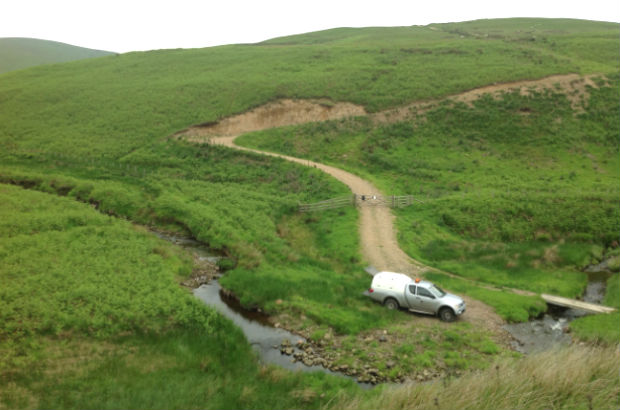
It's a great job, but the best part is working with the technology. The clever part of the kit we use is that the sondes are connected to a telemetry unit (via ESNET) that puts the data straight onto the internet. Within minutes of the equipment being activated, you can see the data on a smartphone or a tablet and within a few days you can start to build up a picture of what is happening within the river. As the kit is small and mobile, it is great when we have to be reactive and gather data during a pollution incident, helping to determine the impact on the environment.
So, what does the data look like? The graph below shows how a typical rainstorm has affected the water quality at a site up in the Northumberland Hills. On the 13th the rainfall has increased the flow in the river, picking up sediment from in the river and surrounding area, causing an increase in turbidity (brown line). You can also see how much the temperature (red line) varies during the night and day.
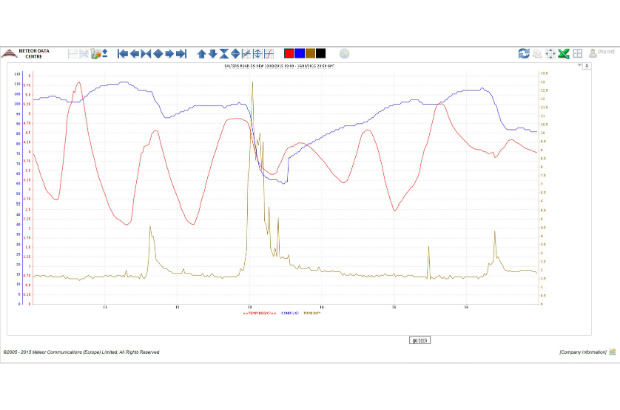
It is the turbidity levels we are interested in with this project. We compare this graph to a site upstream and if the same peaks do not appear, we know that too much sediment is entering the water and we need to look at a way of reducing this. The Northumberland National Park Authority are looking at solutions to this, including hill track management such as soil inversion (where soil is turned upside down to bury the nutrient enriched surface layers) or installing drainage channels to reduce the amount of sediment carried in the runoff from farm and shooting tracks across the Cheviot Hills.
If you are interested in more of the work we do around the country, keep an eye out for the #NWQIS on @EnvironmentAgency Twitter page and look out for another blog post in the future, when the team have settled in their new lab accommodation and reveal more about work carried out in the south of England.
Andy Newton has worked in the NWQIS for the past three years as a Field Scientist, but has been at the Environment Agency for over 10 years, most of that time spent working with sondes on the Cumbrian lakes and tarns.
2 comments
Comment by Rob Seago posted on
This is brilliant. Imagine now miniaturization, internet of things and mass production followed by cost falling.
Comment by Graham Holmes posted on
Great piece of kit. I used to do all the same readings individually and by hand. This is sooo useful!