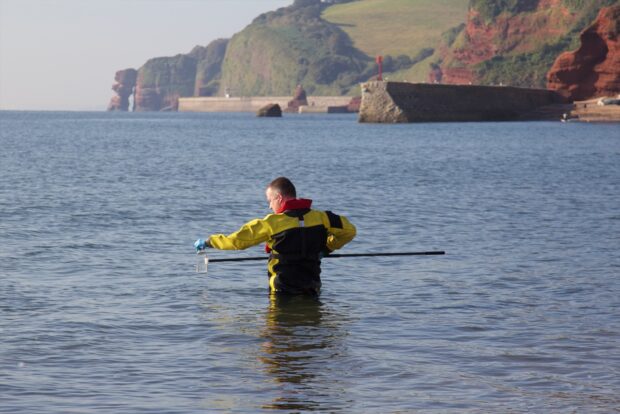
Our blog on 1 February explained how we approach monitoring, sampling and testing of bathing waters and our approach to keeping public informed and warned when there are short term risks of pollution which bathers would rightly want to be alerted to.
A bit of history
The concept of managing areas of water for the protection of bathers’ health was introduced by one of the first European Directives in 1976. At the time, classifying bathing water quality was a pass or fail against the standards. In 2006, based on World Health Organisation (WHO) recommendations, a revised Bathing Water Directive introduced the classifications of Excellent, Good, Sufficient or Poor. These classifications were first made in England in 2015 and are what we use today.
An annual report is produced each year listing the classifications based on a long-term assessment of water quality over a four-year period with samples being taken at each bathing water site during the bathing water season, between May and September each year.
The classifications have many uses including showing trends, allowing comparisons of water quality between bathing waters and also informing decisions on long-term pollution reduction measures. They give an overall indication that helps people make a choice on which bathing water to visit. Most sites are sampled weekly and the cleanest have fortnightly sampling. For more information on sampling, read more on this blog.
Pollution risk forecasting
WHO also recommended that bathers should be able to easily access a warning system so they know when there is expected to be a reduction in water quality caused by Short-Term Pollution (STP) events. To deliver our regulatory duty in relation to short term pollution, we have developed a Pollution Risk Forecasting (PRF) system. The Environment Agency uses weather and tidal data and other sources of information to make pollution risk forecasts to work out when bathing water quality might be temporarily reduced due to factors such as the weather. When the forecasts highlight an increased risk of reduced water quality, pollution risk warnings will be issued and advice against bathing is displayed on Swimfo – the online tool that allows you to look up details of a designated bathing water by name or location – and on signs at the beach.
This system does not specifically make predictions of sewage pollution – the predictions include bacteria from all sources - instead it forecasts expected variations in water quality due to the measurable effects of rain, wind tide, sunlight and time.
Daily forecasts of water quality allow bathers to make informed choices before going for a swim. Pollution risk forecasts are made at all bathing water sites where this is possible. Last year PRFs were made at 171 of the 424 designated sites.
Why do we disregard some samples?
Bathing water quality is measured by sampling and analysing bacteria in the water, which is complex and changeable. WHO recommends that an overall bathing water classification should take into account where short term pollution warnings have been issued.
Back to the legislation and regulation - in England, the Directive was transposed into the Bathing Water Regulations 2013. Under these Regulations, samples taken during a time where bathers have been advised against bathing may be disregarded from the overall classification.
This is because a warning against swimming has been issued in advance and the conditions are not considered to be reflective of the actual water quality most people bathe in.
We only do this where we have confirmed that bathers were actively warned through Local Authorities displaying dated signs at the beach.
The Regulations specify up to 15% of samples may be disregarded, but in practice this rarely happens and last year about 3% of eligible samples were disregarded.
All of our bathing water sampling data is made freely available via Swimfo in a transparent way. This includes those samples that were taken during a pollution risk warning, together with a flag of whether this was later disregarded from classification or not.
From the wide range of data available, it has always been possible to calculate classifications in different ways including what they would have been if samples disregarded under STP were included.
While the data is available to all, for ease of access and following recent media interest, we have produced a summary of bathing water classifications which includes samples disregarded under STP which can be downloaded.
| Classification |
| 2015 | 2016 | 2017 | 2018 | 2019 | 2021 | 2022 | 2023 | |
| Sites | 418 | 415 | 415 | 422 | 421 | 419 | 421 | 424 |
| Excellent | 264 | 287 | 271 | 282 | 302 | 295 | 302 | 281 |
| Good | 110 | 98 | 109 | 106 | 90 | 100 | 87 | 99 |
| Sufficient | 29 | 22 | 26 | 23 | 21 | 18 | 18 | 25 |
| Poor | 12 | 6 | 7 | 9 | 7 | 4 | 12 | 18 |
| Classification adding samples disregarded during STP events |
| 2015 | 2016 | 2017 | 2018 | 2019 | 2021 | 2022 | 2023 | |
| Excellent | 257 | 271 | 253 | 265 | 291 | 280 | 290 | 274 |
| Good | 104 | 100 | 107 | 104 | 80 | 91 | 86 | 94 |
| Sufficient | 38 | 32 | 38 | 35 | 32 | 30 | 21 | 29 |
| Poor | 16 | 10 | 15 | 16 | 17 | 16 | 22 | 26 |

2 comments
Comment by Ian posted on
Swimming in low land rivers should be banned on health grounds
Comment by Sue De-la-Salle posted on
In Cornwall it rains a lot so SWW regularly dump sewage into sea, this is when it should be checked as still people and dogs in water. Never seen a sign on the beach.
It needs to stop.